Multidimensional problems require multidisciplinary approaches
Unfortunately, climate change, a global phenomenon disrupting the lives of many species, is difficult to tackle when we are not aware of its complexity and not equipped with the necessary knowledge. Having physical and meteorological data is not enough. The people affected and the established support systems are often overlooked which vastly differs from country to country—developed to developing.
Currently, I am in the fourth week of my internship here at MIT. I feel overwhelmed having a crazy number of resources, from research facilities to grad school application mentors. Frankly, they make it hard not to apply and attend school here—you know, aside from the fact that it is “MIT”. At the same time, I have been reading lots of literature to get the gist of my project and come up with a proposal for the summer. It’s daunting to think that I spent a quarter of the program thinking about what I’ll be doing. To be honest, I have been feeling a lot of pressure, but I choose to give myself some grace, knowing that I am dealing with a new project.
In my previous blog, I introduced what my research group primarily does (tl;dr, Space Enabled seeks to advance sustainability using various space technologies). One flagship project they have is the EVDT framework, which stands for Environment-Vulnerability-Decision-Technology. It models complex systems such as climate change and is used to develop an interactive decision support system for sustainable applications. 1 The novelty behind the framework is its multidisciplinary approach in providing data-driven insights to an organized system of policymakers and stakeholders surrounding a specific issue. Some use cases of the framework are the following:
- Mangrove conservation in Brazil
- Flood resilience in Indonesia
- Plant species management in Benin
- COVID-19 response in world’s major cities
- Collision avoidance in space
In my case, I am working on Angola’s Drought Decision Support System. Specifically, I am trying to see if there is a correlation between the severity of drought (E) and the socioeconomic vulnerability (V) of every municipality in Angola. This correlation could shed light on areas that are not only experiencing the brunt of the drought but also the least prepared for it.
To do this, I am proposing three goals for the summer.
- First, I will generate an index that captures the synergistic effects of soil moisture content and socioeconomic vulnerability. This involves pulling remote sensing data from SMAP (Soil Moisture Active Passive) and socioeconomic data like GDP per capita, poverty rate, literacy rate, educational attainment, etc. The index is then used to generate drought severity-socioeconomic vulnerability (SV-DV) mappings every month from 2015-2023.
- Second, I will implement statistical tests to quantify the magnitude of the relationship of each socioeconomic indicator to the soil moisture content.
- Finally, the most important piece is relating the narratives of Angolans to the generated maps and data visualizations. For instance, the maps should tell us that one of the most sensitive socioeconomic indicators based on the statistical test is access to basic healthcare. This comes from recent news sharing the struggles of farmers and pregnant women in walking 30 km to the nearest hospital. (‘Between Risk and Despair,’ n.d.) I hope to include these visual aid pieces, along with existing narratives, to portray what it’s like to experience such a phenomenon.
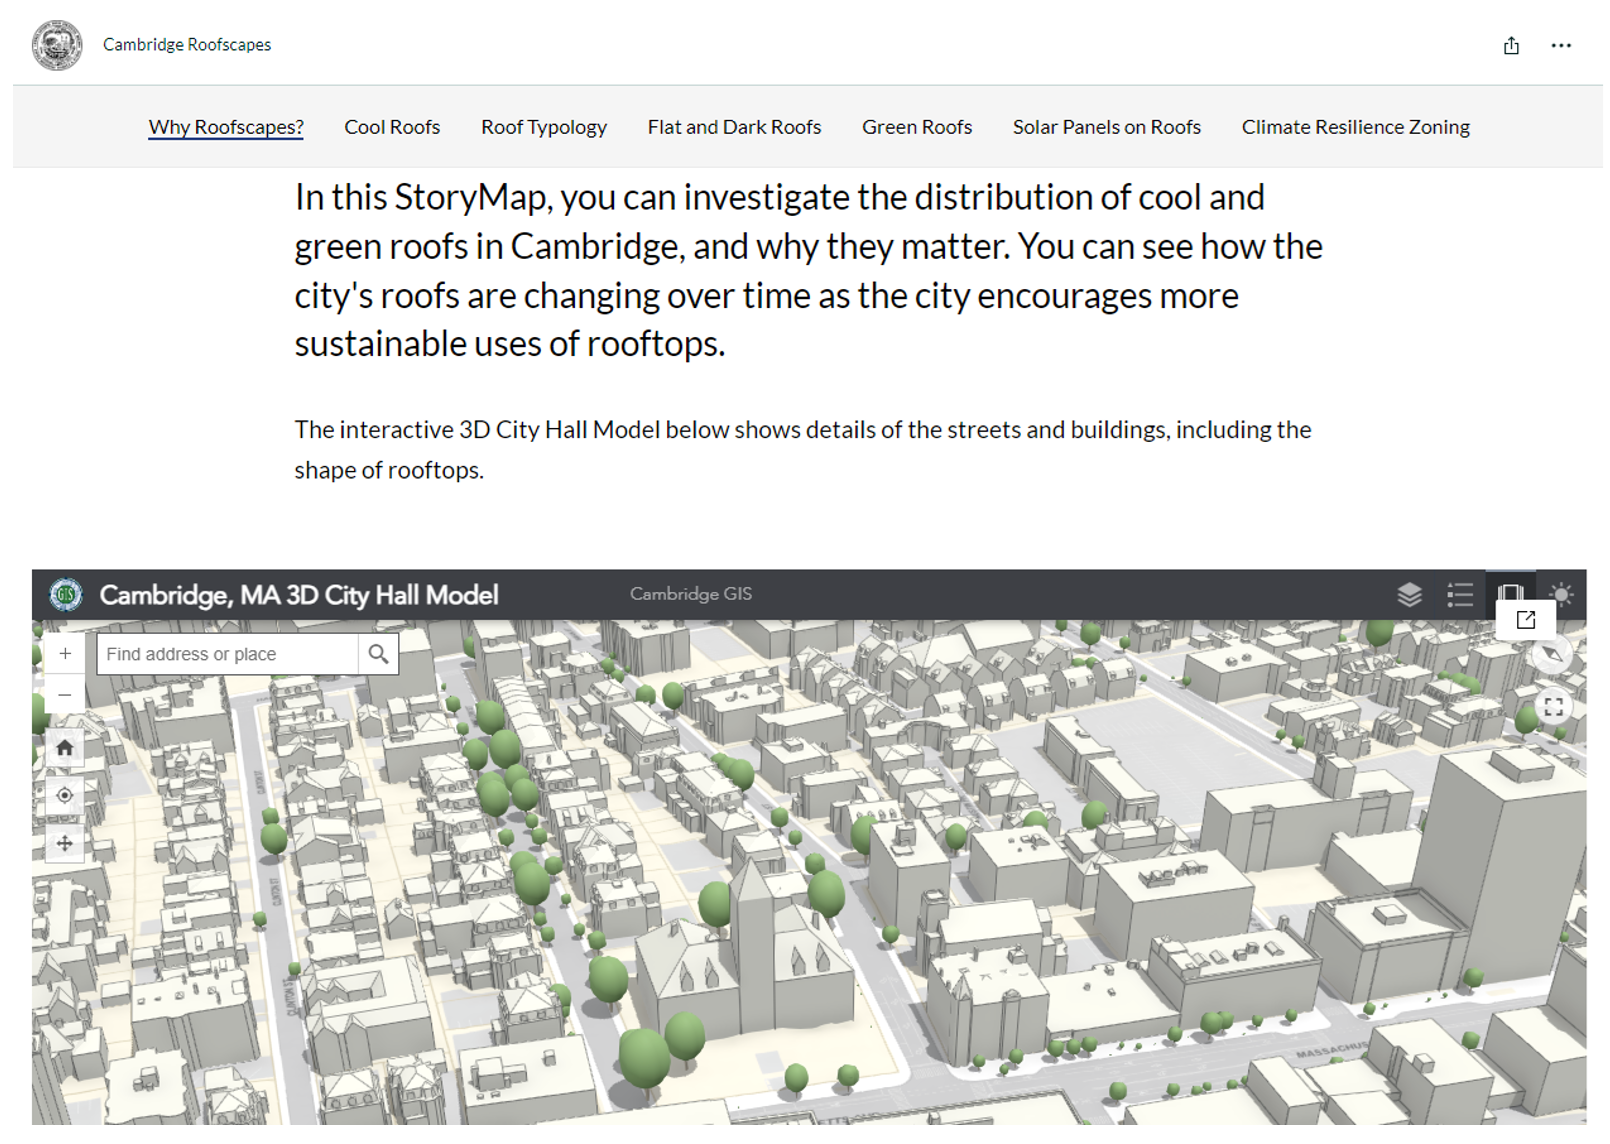
 A sample ArcGIS StoryMap explaining how cities can be cooled using a certain type of roof. 2
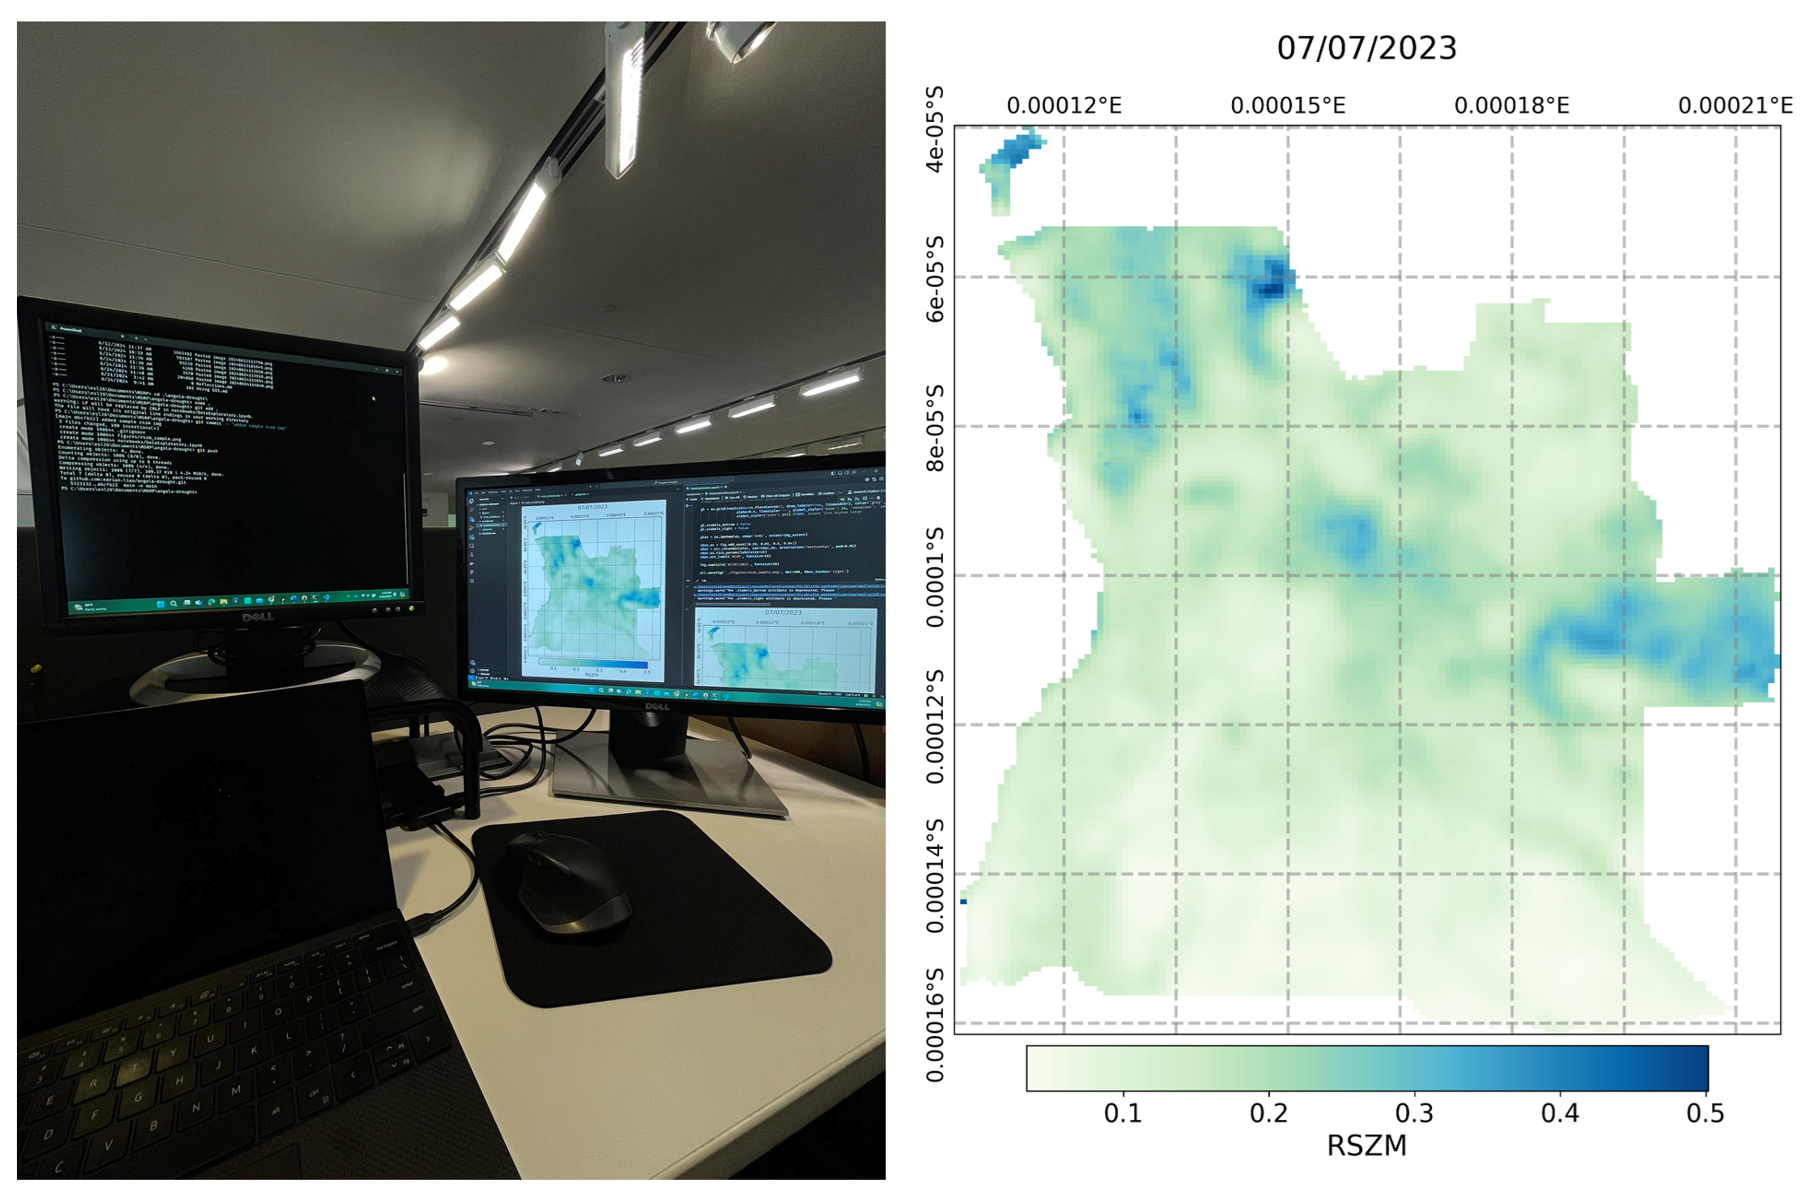
I am getting more excited day by day because now, I get to implement my proposed methods and “be in action”. Earlier, I was happy I got my first script to work. Below, you can see a snap of my workspace while coding and a map I generated that shows the soil moisture content in Angola last July 7th, 2023.
 RSZM means Root Zone Soil Moisture which describes the amount of water available for plant use.
It is amazing to think that I am part of this project, which combines multiple equally important disciplines to show a more detailed picture of a multidimensional problem. Beyond what I am working on, the rest of the team asks questions like “What interventions are currently being implemented?” “Do they include both short-term and long-term solutions?” “What other technologies can potentially be used to improve Angola’s drought decision support system?”, “Now that they are about to have elections, how will the new leaders’ platforms affect the politics that drive this system?”
This framework, hopefully, will immensely help those who have the power to determine their priorities and strategically implement existing solutions.
Reference
‘Between risk and despair’: Cyclical drought hurts pregnant women in Angola. (n.d.). Al Jazeera. Retrieved June 20, 2024, from https://www.aljazeera.com/features/2023/11/6/between-risk-and-despair-cyclical-drought-hurts-pregnant-women-in-angola